



A newly introduced dashboard in the PushPushGo panel allows you to track and analyze the results of your push campaigns and automation scenarios, and also compare the projects throughout your organization. You'll also learn more about your subscribers, their preferences, and patterns when interacting with push notifications. Let's take a look!
While designing the dashboard, we considered the most important metrics of web and mobile push campaigns.
In the panel, you can see:
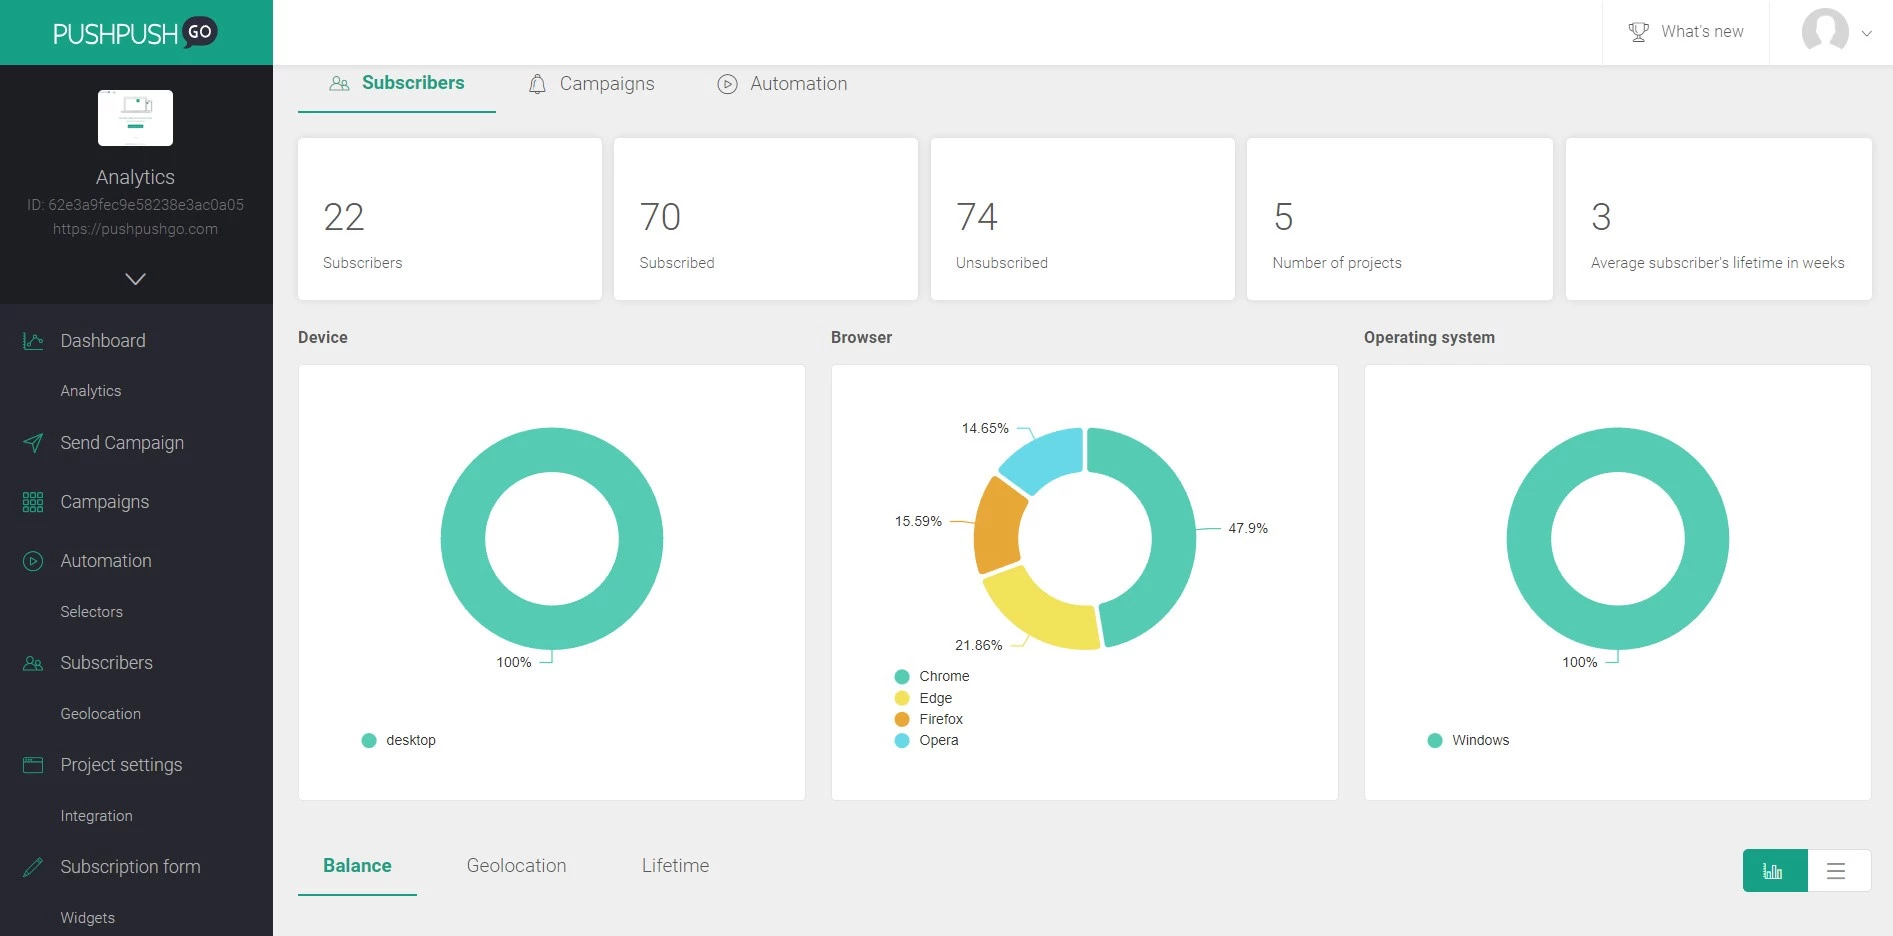
The people you interact with are a crucial part of any e-marketing strategy. That's why it's crucial to know them and understand how they come in contact with push notifications. That's why in this section, you'll find information on:
But that's not all. You can see the geographical location of your subscribers - which is important if you work internationally and would like to address the problem of time zones.
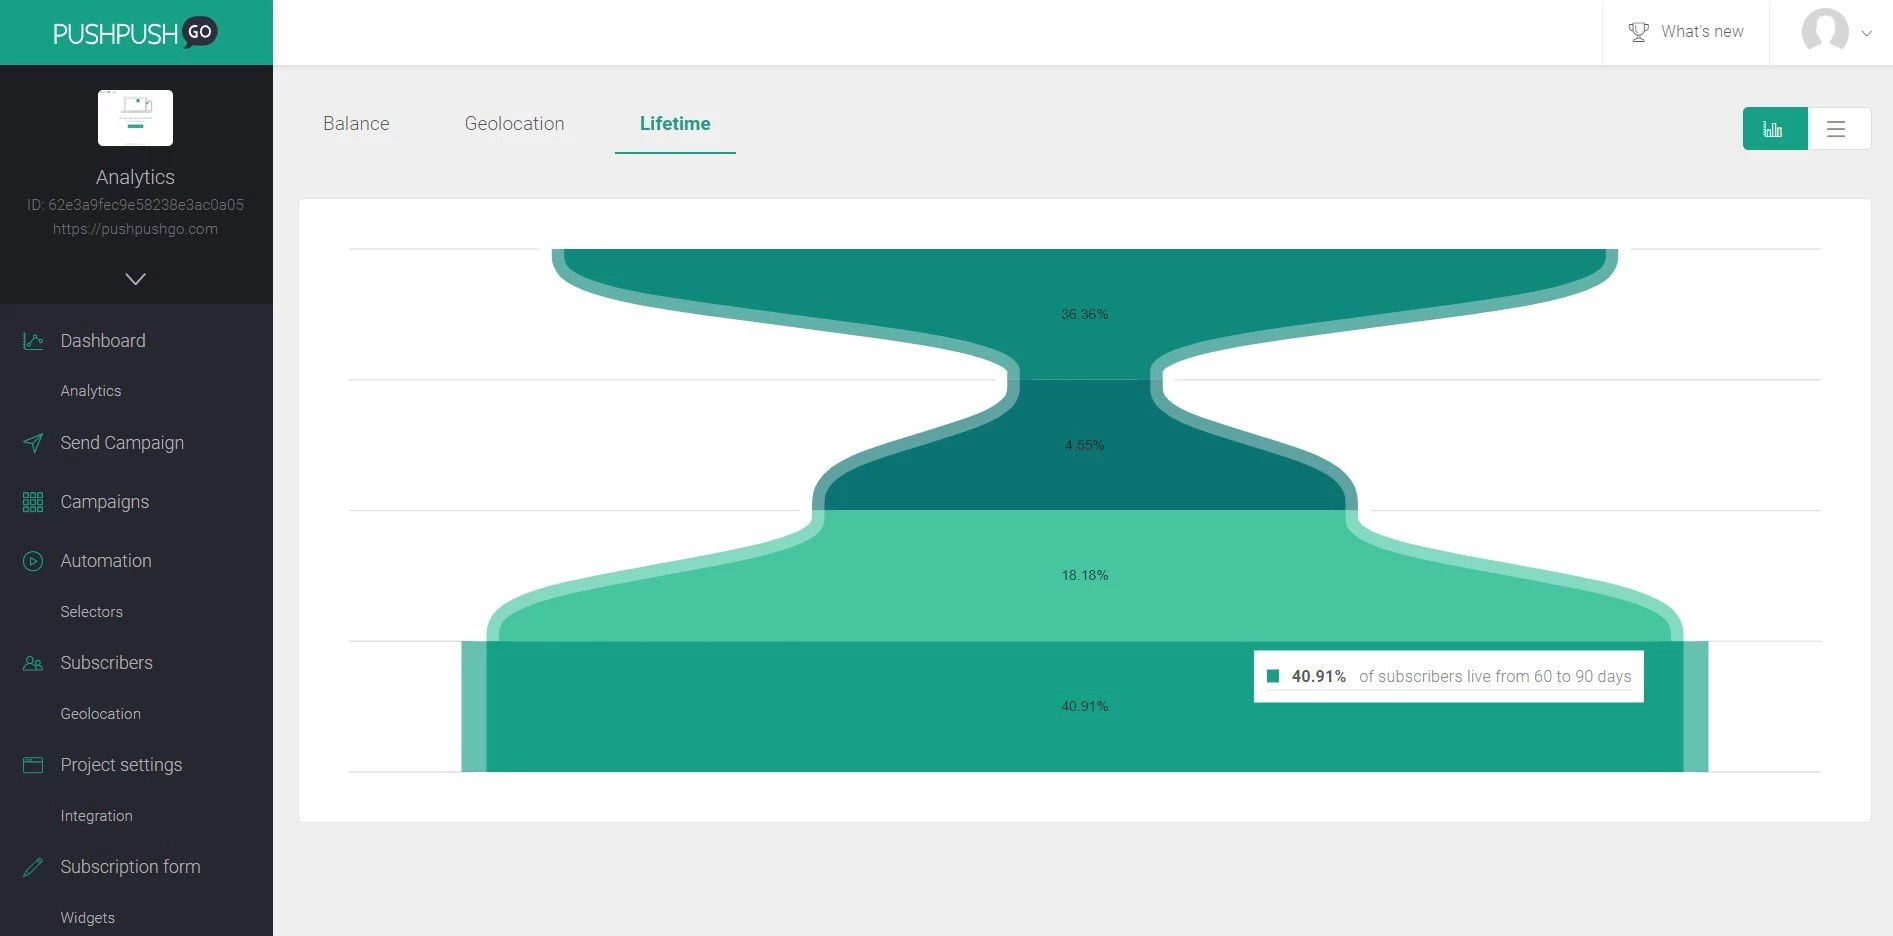
We've also prepared a subpage on subscribers' lifetime. It's a chart similar to the population pyramid. It shows the time that passed from the moment of the user’s subscription.
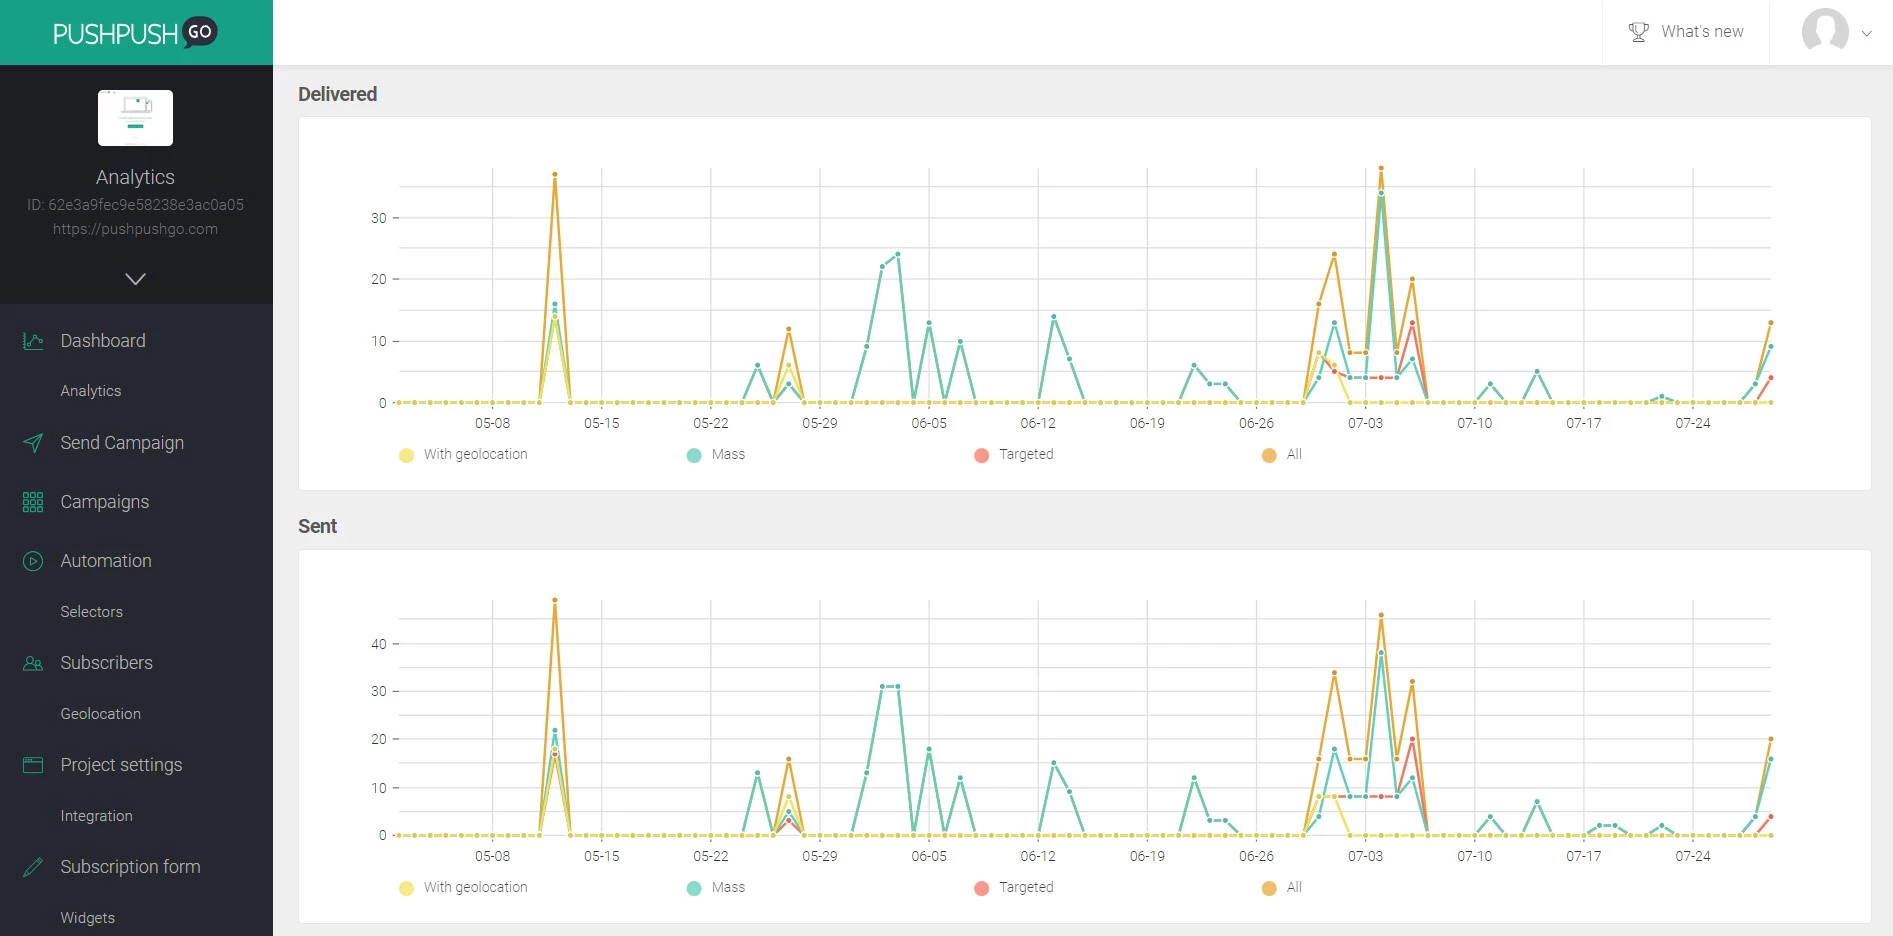
If you seek more information on your campaigns and their results, head to the Campaigns section. This part of the dashboard contains all the information you need about your campaigns. You can switch the data to view all of them: mass, targeted and based on geolocation.
What exactly can you find in this section?
Other useful statistics show sending hours and subscribers' activity. It can be useful if you want to see when the campaigns were sent and compare it to the time when users clicked on them. It may help to set up expire time of notifications.
We also introduced a Content analysis - a list of words used in titles and content of your push notifications sorted by their CTR. We excluded articles, conjunctions, and pronouns for clarity.
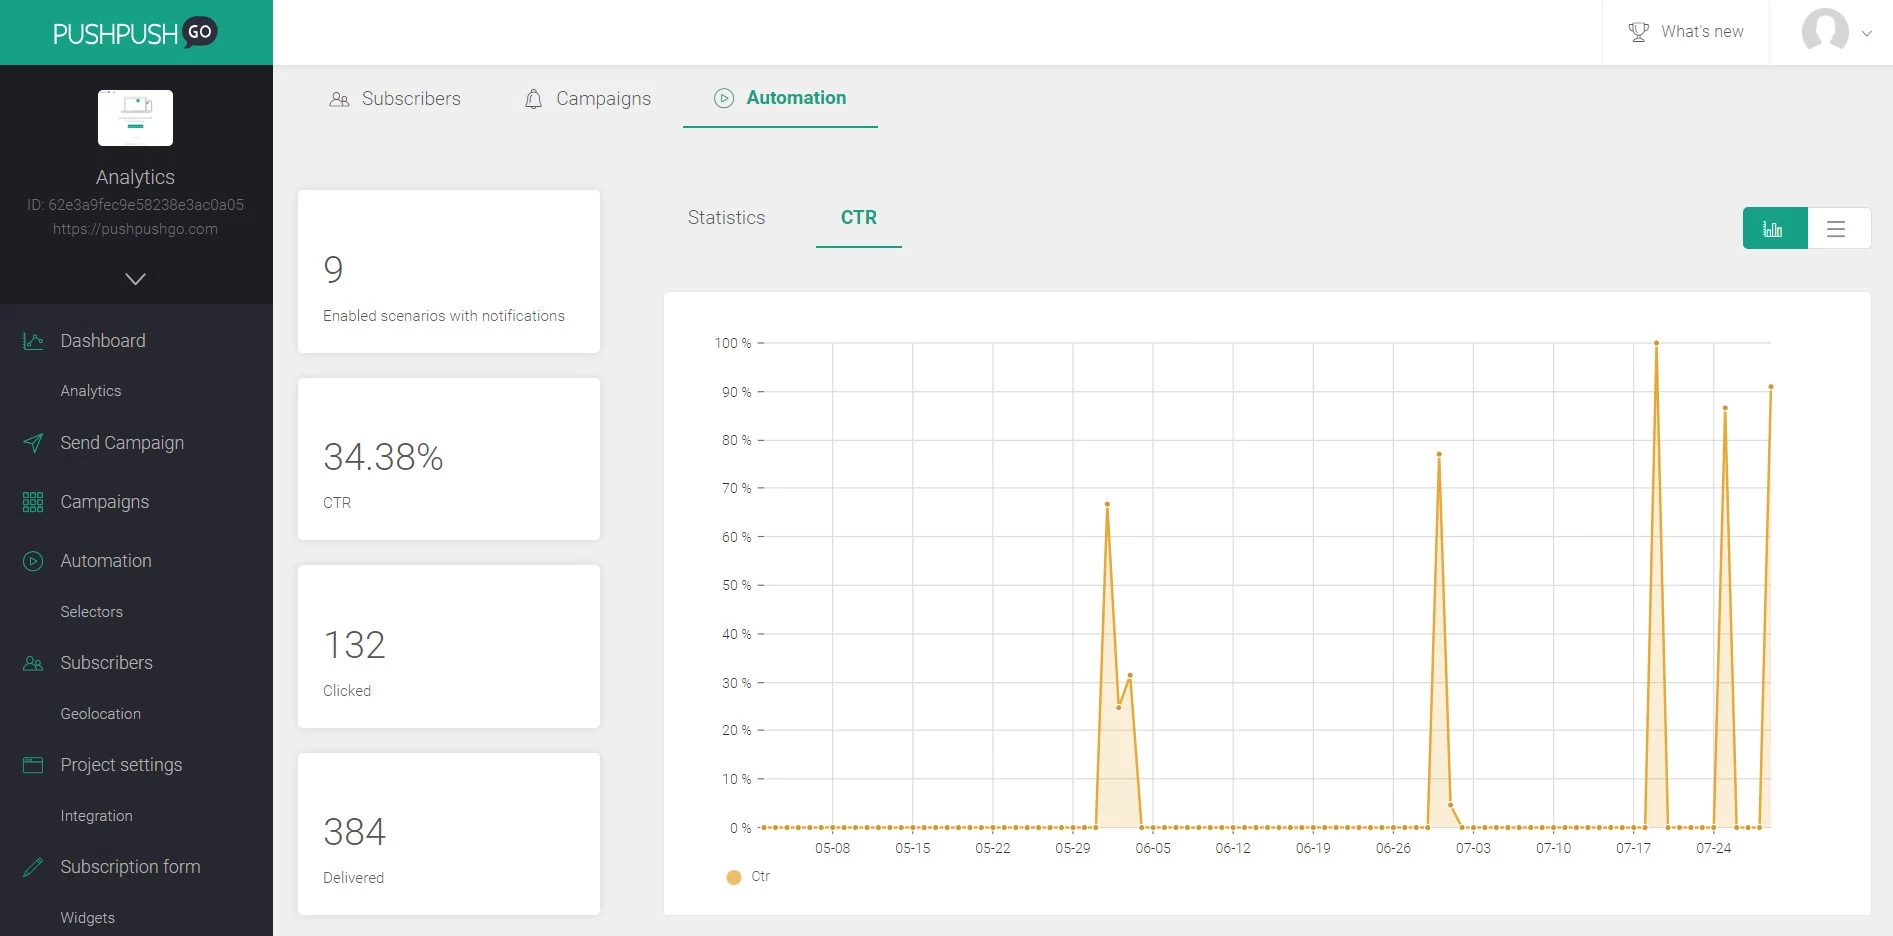
Automation scenarios also deserve a good analysis. We prepared the most important statistics about campaigns sent in automation scenarios. It starts with the most basic information about the number of automations with at least one campaign set up. Apart from that, the dashboard displays the same information you can find in the Campaigns section: CTR, clicked, delivered, statistics and DSP.
Below, you'll find Automation Rank: a list of the top three automation scenarios with at least one campaign. You can switch between sorting by the number of clicks and CTR.
In this section, you'll find a summary of the most important statistics of your push notification activities across different projects in your organization.
The data is presented in the form of graphs and charts or lists. It’s an easy and comprehensible way to compare and contrast performances of different projects you conduct.
Information is power - that's why we strive to give you all important data in a simple, comprehensive, and accurate form. This way, you can improve and expand your push notifications strategy.
If you want to learn more, contact our team at support@pushpushgo.com
Editor and writer. She is interested in media and new technologies.
.png)
.png)
-3pf2xltbnb.webp)

Mi tincidunt elit, id quisque ligula ac diam, amet. Vel etiam suspendisse morbi eleifend faucibus eget vestibulum felis. Dictum quis montes, sit sit. Tellus aliquam enim urna, etiam. Mauris posuere vulputate arcu amet, vitae nisi, tellus tincidunt. At feugiat sapien varius id.
Eget quis mi enim, leo lacinia pharetra, semper. Eget in volutpat mollis at volutpat lectus velit, sed auctor. Porttitor fames arcu quis fusce augue enim. Quis at habitant diam at. Suscipit tristique risus, at donec. In turpis vel et quam imperdiet. Ipsum molestie aliquet sodales id est ac volutpat.
Elit nisi in eleifend sed nisi. Pulvinar at orci, proin imperdiet commodo consectetur convallis risus. Sed condimentum enim dignissim adipiscing faucibus consequat, urna. Viverra purus et erat auctor aliquam. Risus, volutpat vulputate posuere purus sit congue convallis aliquet. Arcu id augue ut feugiat donec porttitor neque. Mauris, neque ultricies eu vestibulum, bibendum quam lorem id. Dolor lacus, eget nunc lectus in tellus, pharetra, porttitor.
"Ipsum sit mattis nulla quam nulla. Gravida id gravida ac enim mauris id. Non pellentesque congue eget consectetur turpis. Sapien, dictum molestie sem tempor. Diam elit, orci, tincidunt aenean tempus."
Tristique odio senectus nam posuere ornare leo metus, ultricies. Blandit duis ultricies vulputate morbi feugiat cras placerat elit. Aliquam tellus lorem sed ac. Montes, sed mattis pellentesque suscipit accumsan. Cursus viverra aenean magna risus elementum faucibus molestie pellentesque. Arcu ultricies sed mauris vestibulum.
Morbi sed imperdiet in ipsum, adipiscing elit dui lectus. Tellus id scelerisque est ultricies ultricies. Duis est sit sed leo nisl, blandit elit sagittis. Quisque tristique consequat quam sed. Nisl at scelerisque amet nulla purus habitasse.
Nunc sed faucibus bibendum feugiat sed interdum. Ipsum egestas condimentum mi massa. In tincidunt pharetra consectetur sed duis facilisis metus. Etiam egestas in nec sed et. Quis lobortis at sit dictum eget nibh tortor commodo cursus.
Odio felis sagittis, morbi feugiat tortor vitae feugiat fusce aliquet. Nam elementum urna nisi aliquet erat dolor enim. Ornare id morbi eget ipsum. Aliquam senectus neque ut id eget consectetur dictum. Donec posuere pharetra odio consequat scelerisque et, nunc tortor. Nulla adipiscing erat a erat. Condimentum lorem posuere gravida enim posuere cursus diam.