

There are many factors that affect the deliverability and click-through rate of push notifications - some are within your control, and others are completely beyond your control. That's why it's so important to monitor push notification activity and quickly catch upward and downward trends in your app. Analytics of push campaign performance and automation scenarios will help you identify problems and implement quick improvements where possible.
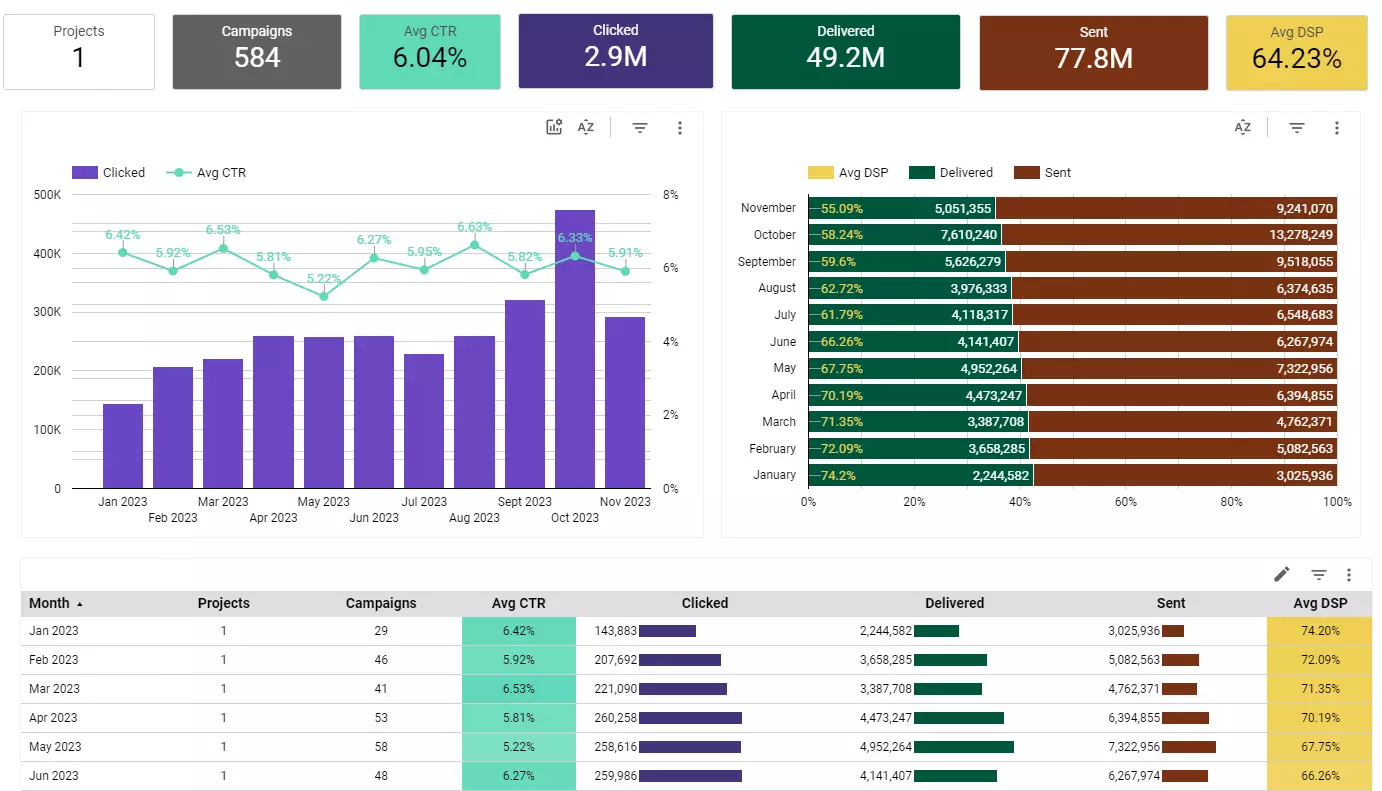
In our analytics dashboard, you will find key data on the effectiveness of push campaigns in your project and in all other projects of the organization.
In the new PushPushGo analytics panel, you can analyze and monitor statistics of:
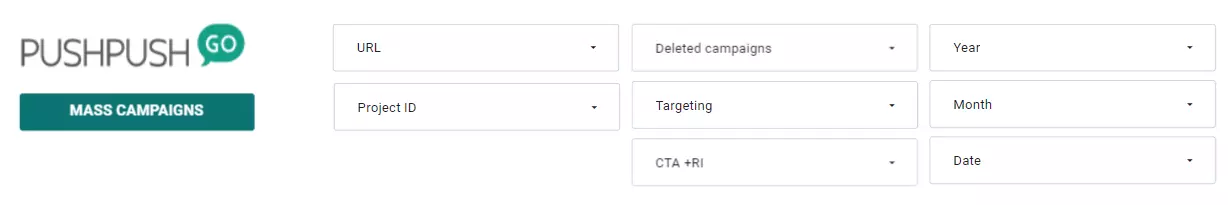
By using advanced filtering and sorting, you will quickly access the data that interests you. Clear and intuitive charts and tables in the analytics panel will make it easier for you to identify trends and any anomalies.
In the PushPushGo analytics panel, you can analyze your push campaigns across various time dimensions. This way, you can check how notification settings impact their click-through rates. You can compare results based on the sending hours, character counts, and added images. If you have multiple projects sending push notifications, you can monitor and compare their results together.
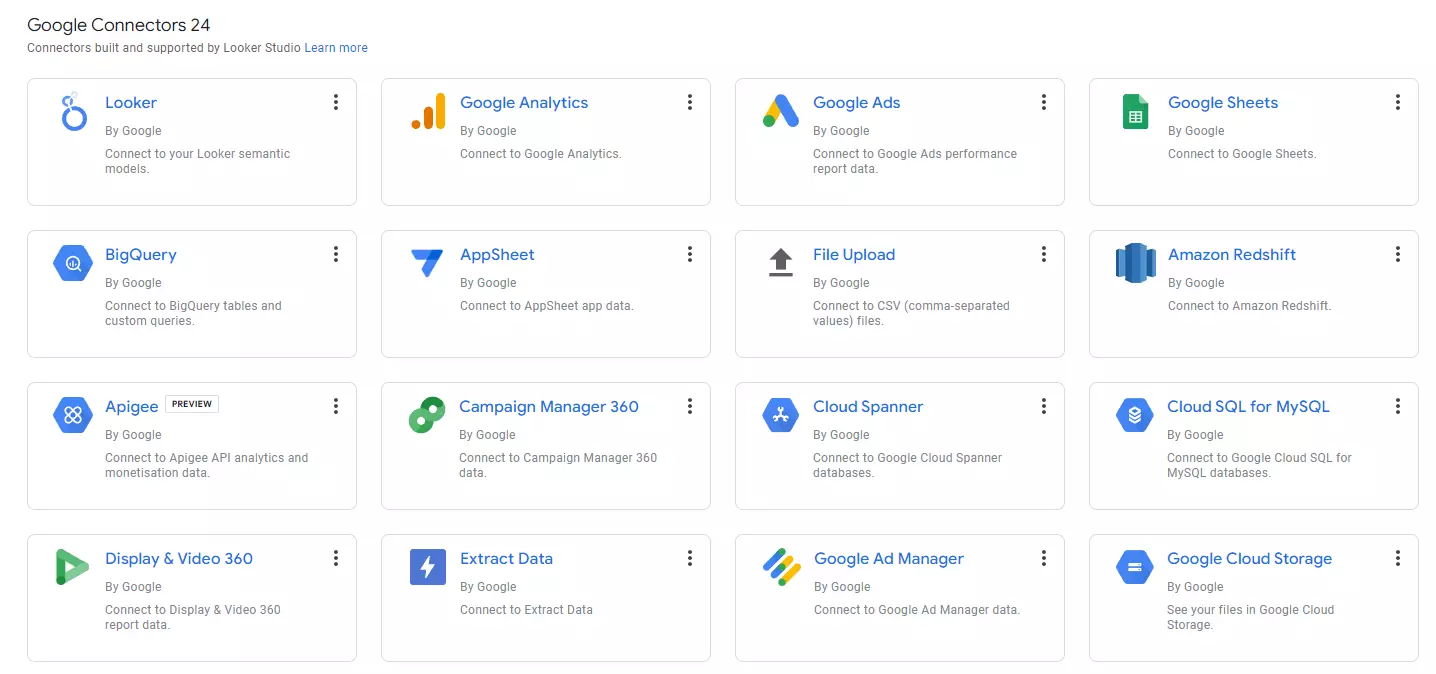
The PushPushGo analytics panel is built on Looker Studio, a tool by Google for advanced analytics. This allows you to import data from other tools provided by Google (such as Google Analytics, Google Tag Manager), as well as from sources independent of Google.
Sometimes a push message about a hot promotion or with important news from the country or the world doesn't bring the high click-through rate you were hoping for. In such a situation, it's worth taking a closer look at the notification you sent. Perhaps its title was too long or the most important content was at the end of the description and was "cut off", so subscribers didn't get a chance to read it. Or perhaps a call-to-action that was used left out the words that could catch the attention of the recipients?
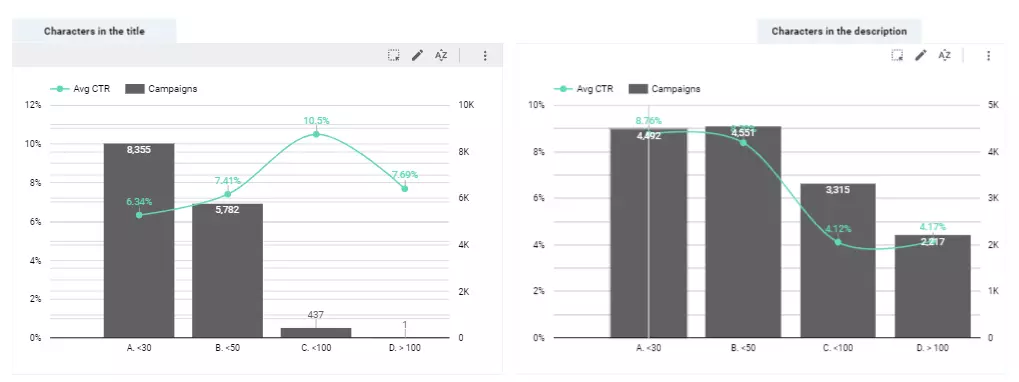
In the analytics dashboard, you will quickly and easily check push campaigns from a selected period and see what content your audience is most interested in. You will also control the number of characters in the title and message, as well as the configuration of the push notification itself. This can be used to prepare AB tests to see what your subscribers respond best to.
When looking for inspiration for special occasions like Black Friday or Valentine's Day, you can recall campaigns from a year ago. In the analytics panel, you can compare campaigns from previous years and prepare an optimal push communication calendar.
If several projects within your organization are sending push notifications to a similar target audience with similar content, you can keep an eye on all of them. This will help you determine which push notifications are most successful. This way you can be inspired by the successes of colleagues managing other projects that are achieving better results.
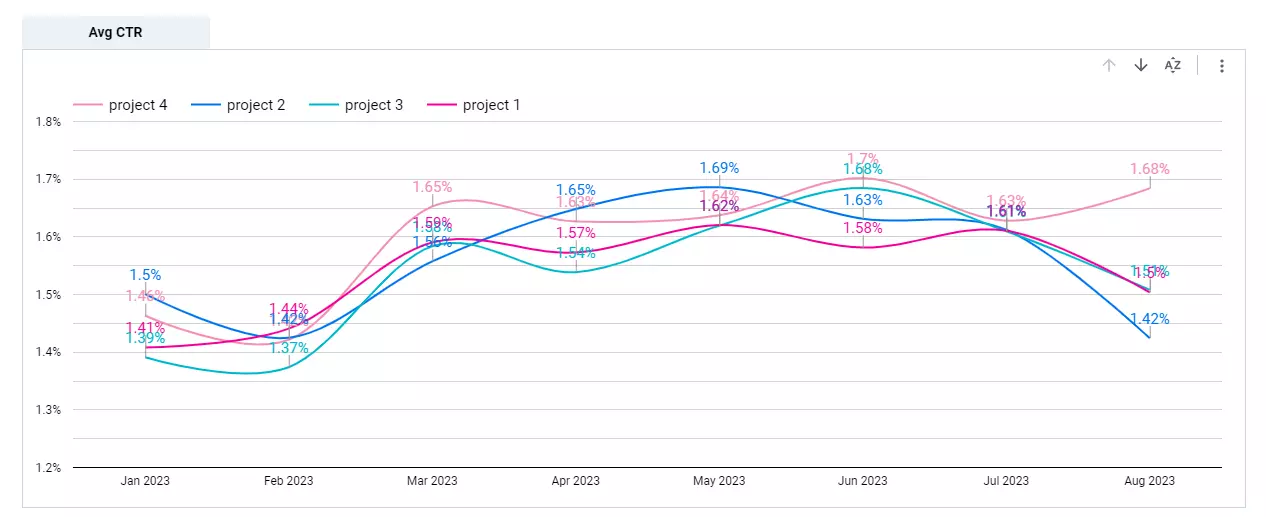
In the new analytics dashboard, you have access to the statistics of all projects in the organization. You can preview in real time how push campaigns are performing on other projects. You may find solutions that you can implement in your push strategies.
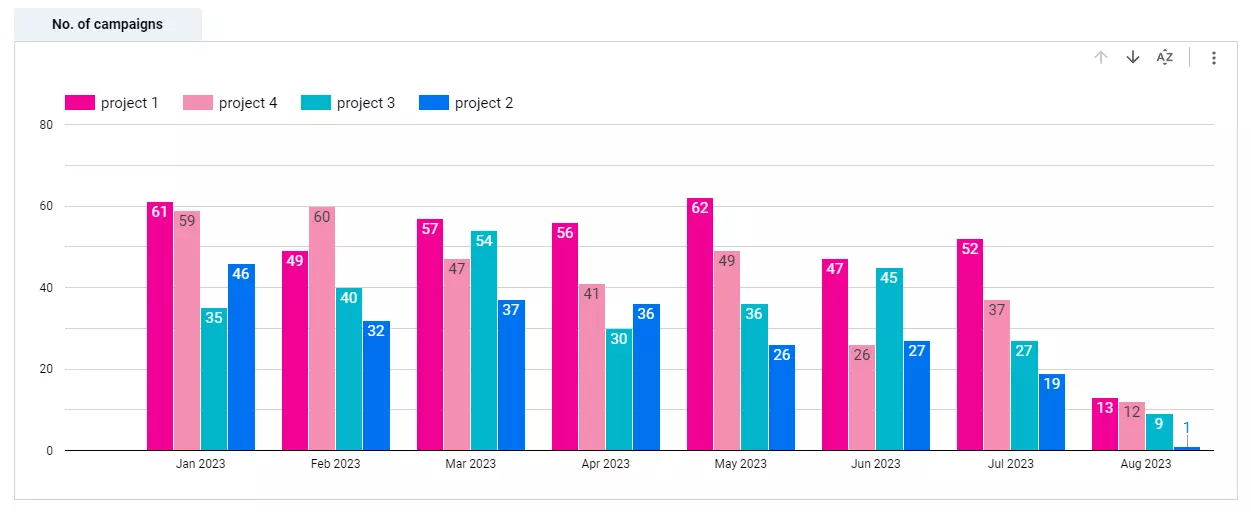
Thanks to filtering and sorting, you will see which campaigns had the best or weakest results in the selected period.
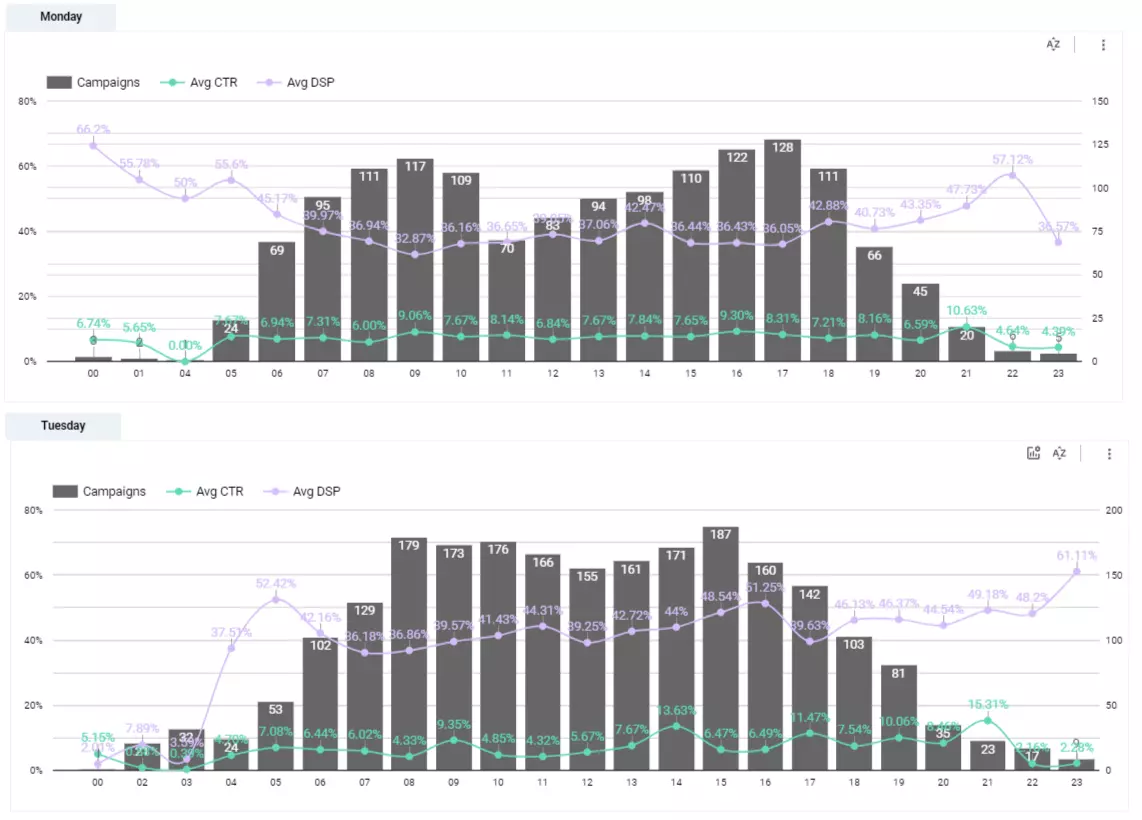
Are you planning to send out your campaign and wondering whether to do it in the morning or evening? And if in the morning, maybe before 8:00 am, because the last Monday campaign converted well at that time? What about weekends? How late do your subscribers like to sleep on Sundays?

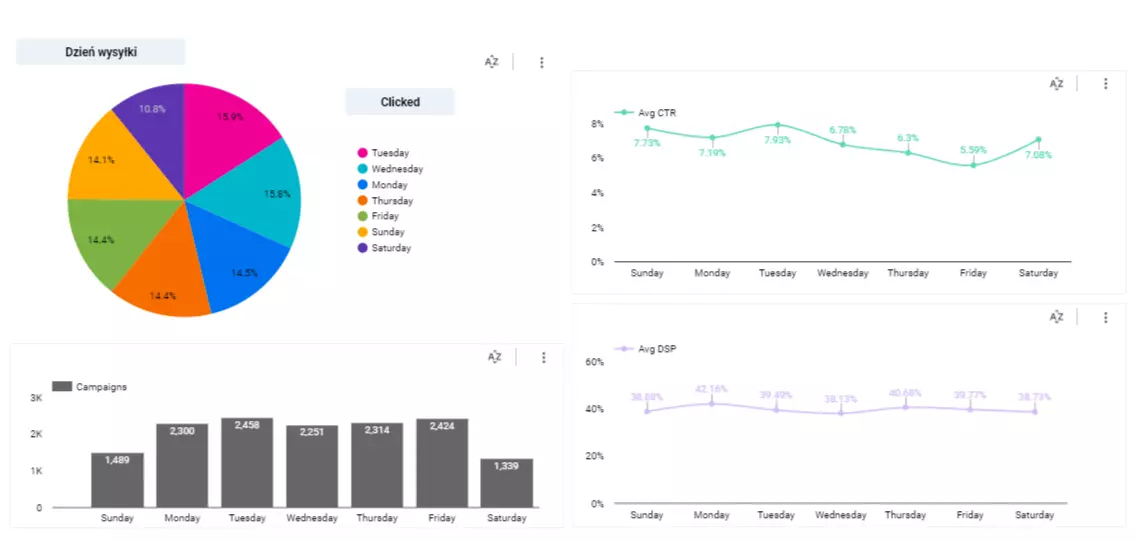
In the analytics panel, you can check at which hours on specific days of the week your campaigns achieve the highest Delivery Success Rate (DSP) and Click-Through Rate (CTR). This will help you determine the optimal sending time when both these indicators show that your subscribers are most active.
Assuming that 99% of campaign deliveries occur within the first two hours of sending, you can thus reasonably determine when your subscribers are likely to have their web browsers active. The more subscribers receive your notification, the greater the chance that they will read it, click on it, and be redirected to the webpage.
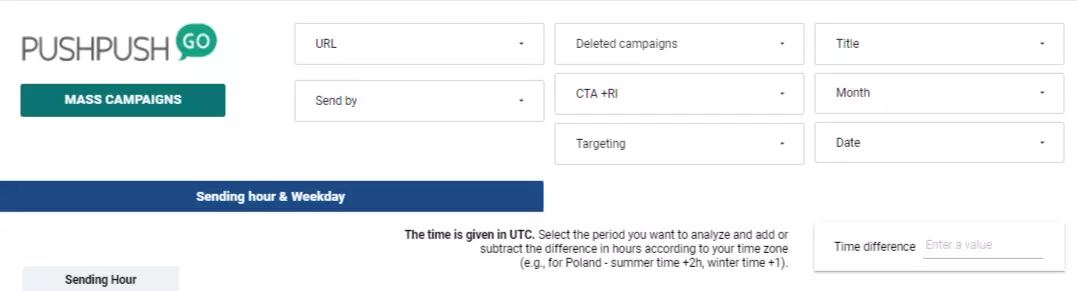
Furthermore, in the analytical panel of PushPushGo, you can quickly analyze whether seasons affect the activity of your subscribers. Whether in winter, when darkness falls quickly, subscribers spend more time in front of their phone or computer screens, or perhaps it's completely the opposite? Simply enter the time difference in the selected period to get the answer to your question.
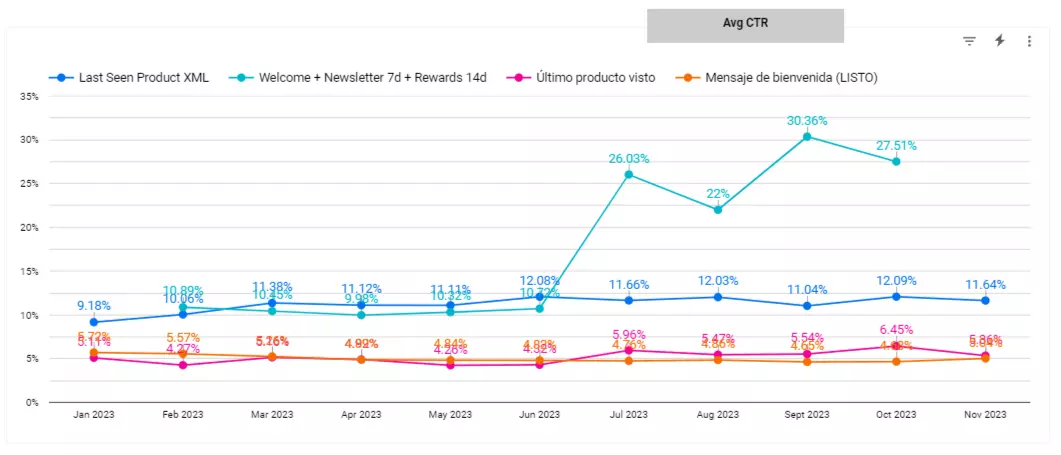
Automation scenarios are a must-have, especially in e-commerce, telecommunications, finance, and tourism industries. Automations such as abandoned cart, recently viewed offers, or deal of the day belong to the most eagerly implemented by our clients. Properly configured and appropriately personalized push scenarios can be more effective than commonly used mass campaigns.
However, once set up, automations should be refreshed from time to time: changing content and replacing images to ensure their effectiveness is optimal. It is worth testing and implementing new solutions because subscribers' preferences constantly change.
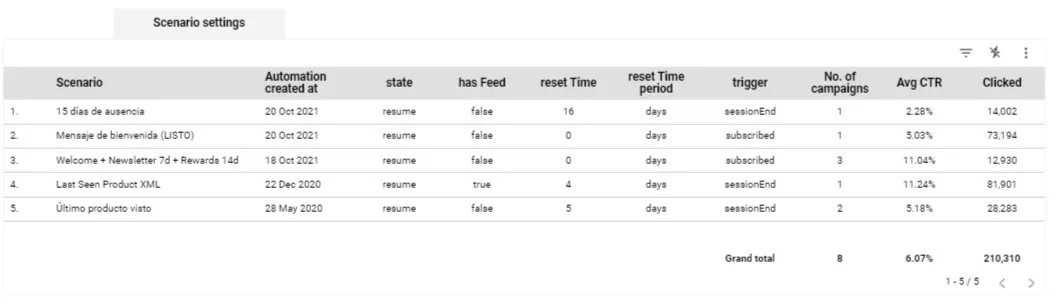
In the new analytical panel, you can compare automation scenarios and check their settings, such as the renewal time or the delay of deliveries, and monitor their performance. There are many configuration options for scenarios, and the analytical panel will assist you in selecting the appropriate settings. For example, you can try sending scenarios promoting special offers when a subscriber enters or leaves the website.
Next to the results of mass campaign deliveries and automation scenarios, it is also important to keep an eye on the subscriber base itself. In the analytical panel of PushPushGo, you will find information about the growth rate of the base and the average daily sign-ups. Monitor and react promptly if you suspect that the sign-up form has stopped working on your website or its subpages.
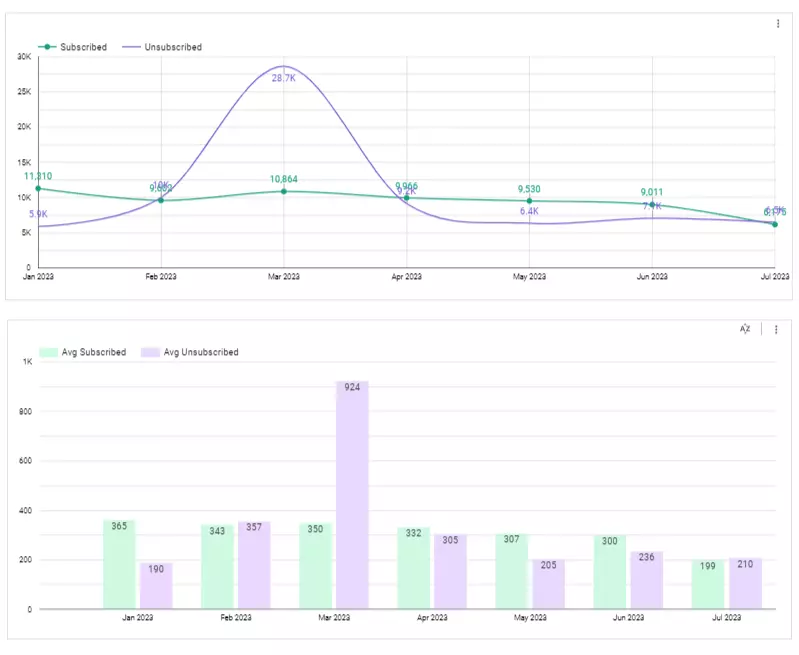
In a simple way, you can check the effectiveness of various subscription forms and choose the one that generates the most sign-ups. Just change the form in the application, and in the analytical panel, you will be able to monitor its effectiveness. More information about available forms and widgets can be found on our blog.
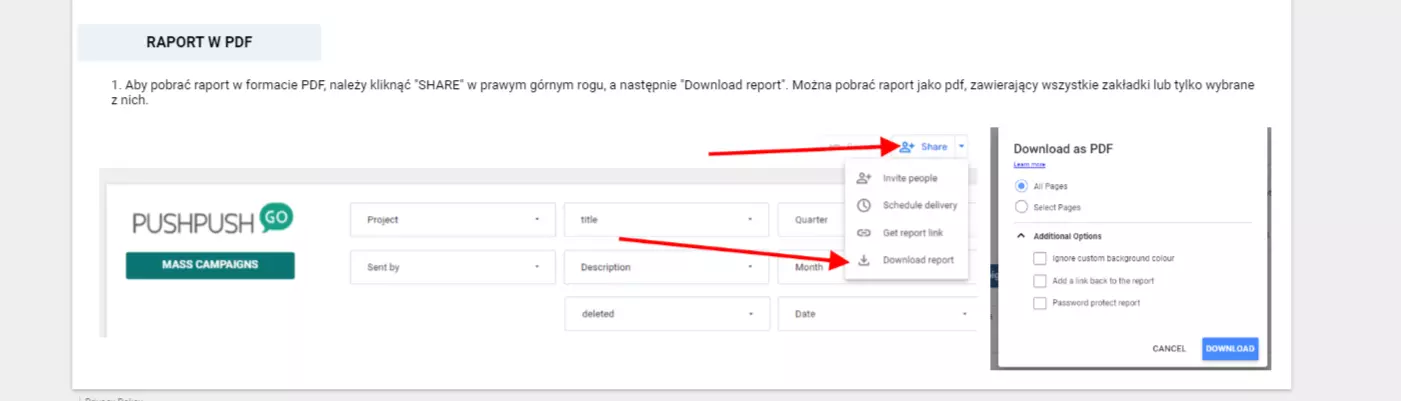
From the panel, you will be able to generate reports in PDF format, featuring selected statistics in a condensed version, visualized through clear charts and tables.
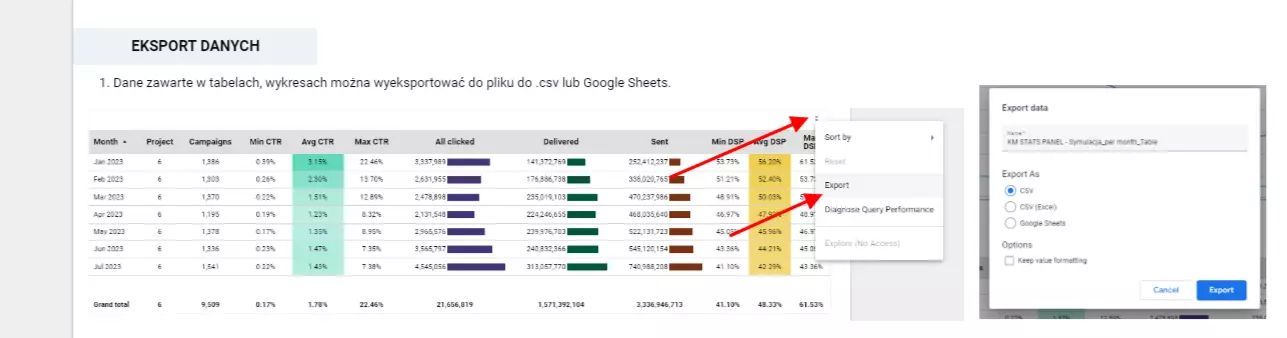
The panel will also allow you to export data from any table or chart to a CSV file or Google Sheets. You only need to select the time range from which the data should be retrieved.
The appearance of the panel, the way data is visualized, and their scope depend on you. The PushPushGo analytics panel will be configured to meet your needs and preferences. Talk to our Customer Support team at support@pushpushgo.com or contact your Account Manager directly.
Take advantage of the new analytics panel, optimize your push campaigns, and save time for other tasks.

For 13 years connected with marketing and advertising, and since 2011 works in the e-commerce industry. At PushPushGo she is responsible for designing automation scenarios and optimizing web push campaigns.
-3pf2xltbnb.webp)
-kzjq5bkqnz.webp)
-7qtlabfqyy.webp)